 Map History

|

|
|
|

|
start | ||
|
|
previous | ||
|
19th Century Ordnance Survey
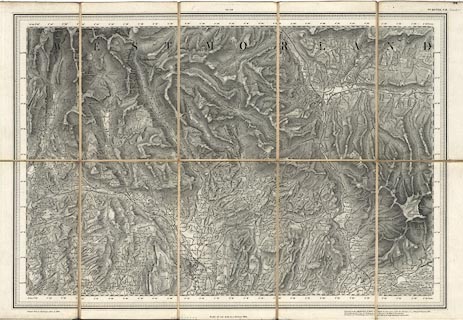 The third era of mapping starts, at least emerges publicly, 1 January 1801 with the first map published by the Ordnance Survey, an area in the south of England. The OS was set up in the 1790s to map the whole of Great Britain. The maps that include Westmorland, Cumberland etc were published in the 1840s-60s; work on the OS one inch maps started in the south and worked north. It is worth noticing that it is the country that is being surveyed not the county. Up till now maps were county by county; these are the major administrative units of the country. The OS maps in what is known as the Old Series of one inch maps break with that tradition. Other OS mapping, the County Series at 6 inches and 25 inches to 1 mile later in the century, organised by counties, were the best available maps for decades. Apart from thematic maps, for tourism as an instance, mapping today tends not to be closely focussed on county units. The OS were not the only map makers to consider the country as a whole at a reasonable scale. John Cary made a New Map of England and Wales, 1794, at a scale of 5 miles to 1 inch. The OS survey was as scientific as it could be. It was approached as a national project, with national resources. A triangulation of the whole country was set in place on which local surveying was based. An approachable description of the survey is published by the OS in:- Owen, Tim & Pilbeam, Elaine: 1992: Ordnance Survey, Map Makers to Britain since 1791: Ordnance Survey (Southampton, Hampshire):: ISBN 0 319 00498 8 (pbk) The Ordnance Survey continues to supply us with 'one inch' maps. The series has gone through several editions, each having major changes of style: colour was introduced; a National Grid Reference system was applied; and lastly the scale was rationalised, the 1 to 63360, 1 inch to 1 mile of the Seventh Series, became 1 to 50000 for the Landranger maps. Printed maps at 1 to 25000, about 2.5 inches to 1 mile, are increasingly popular for everyday use. Charles and John Greenwood 1826
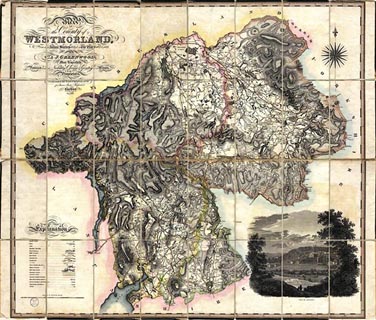 An independent survey of northern counties was made, as part of a national series, by Charles and John Greenwood in the 1820s. They published 1 inch to 1 mile maps of Westmorland, Cumberland, Lancashire, in 1824, each in several sheets. The sheets could have been purchased singly, mounted on rollers, or sectioned for folding, mounted, in a slip case. Other local surveyors worked on their own areas, and in the case of Westmorland there was a furious argument in the Westmorland Gazetter and the Kendal Chronicle, June to September 1823, between the Greenwoods from London and Thomas Hodgson from Lancaster about who ought to be doing the mapping. From the late 19th century onwards in the main the OS are the surveyors for general maps. Bartholomew of Edinburgh being a strong contender for second place, and there are other firms and local individuals who sometimes produce different and exciting maps, particularly thematic maps for special interests. Many maps published were and still are reduced and revised from the Ordnance Survey. The history of map making is no longer county focussed; and its development is the general national and international development of surveying, sensing and mapping. There are still many county maps published to the 20th century, but there are so many from the latter 19th century and beyond that this checklist can make no pretence to be 'complete'. |
|||
|
|
next | ||
|
|
|||
Lakes Guides menu.