 Mill and Heawood 1895

|

|
|

|
back to object record | |
| MAP FEATURES | ||
|
|
||
| printing |
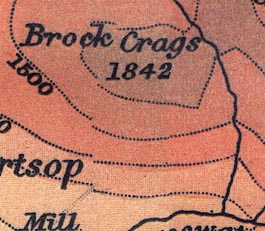
Notice at Brock Crags, south of Angle Tarn, the
misalignment of countour lines. This is probably from a
paste up error in the lithographic process by which the map
was produced.
|
|
|
|
||
|
title cartouche
plain cartouche map maker publisher |
Printed in a plain cartouche, upper left:-
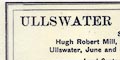
ULLSWATER AND HAWESWATER. SOUNDINGS BY Hugh Robert Mill, D.Sc., and Edward Heawood, M.A., Ullswater, June and July 1893; Haweswater, March 1894. Land Contours from the Ordnance Survey. Height of Surface above Sea Level - Ullswater 476 Ft. (145 Metres). -ditto- Haweswater 694 Ft. (211.5 Metres). Printed top right:- THE GEOGRAPHICAL JOURNAL 1895 Printed bottom right:- Bartholomew Edinr. |
|
|
|
||
|
orientation
up is N |
The map has no indicator of orientation. The map is
printed with North at the top of the sheet.
|
|
|
|
||
|
scale line
scale |
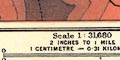
Printed at the bottom is:- Scale 1:31,680 / 2 INCHES TO 1 MILE / 1 CENTIMETRE = 0.31 KILOMETRE and a scale line of 1 mile = 50.9 mm giving a scale 1 to 31618, the map scale is about:- 1 to 32000 2 inches to 1 mile |
|
|
|
||
|
rivers
bridges |
Rivers are drawn by black wiggly line, and might be
labelled, eg:-
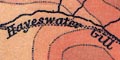
Hayeswater Gill Measand Beck Goldrill Beck An arrow might be used to show the stream's direction, as on the Goldrill Beck entering Ullswater. Bridges are implied where a road crosses and interrupts a stream. |
|
|
|
||
|
lakes
depth contours table of depths layer colouring |
Lakes are plotted accurately in outline, tinted blue, and labelled. Islands are plotted. The map includes:- HAWESWATER ULLSWATER Angle Tarn Hayes Water Brothers Water and not labelled:- Littlewater tarn 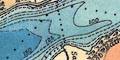
The two main lakes are the subject of the bathymetric survey. Depth contours are drawn, and layer colouring in shades of blue used, mostly at 25 foot intervals. A table of depths is printed on the left. The lines of soundings are shown, with dots for sounding points. At the left of the map a series of longitudinal and cross sections are printed, each with a true and a 15x exaggerated vertical scale. Remember that Hawes Water, at this date, is a lake, not a larger reservoir. |
|
|
|
||
|
relief
contours layer colouring spot heights table of heights |
Relief is shown by contours and layer colouring at
varying vertical intervals. A table of heights is printed on
the left of the map. Spot heights are given at some summits.
Hills might be labelled, eg:-
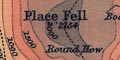
Place fell / 2154 Hallin Fell / 1271 Loadpot Hill / 2201 |
|
|
|
||
|
woods
trees forests |
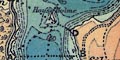
Woodland is indicated by tree symbols. Some woods are
labelled, eg:-
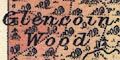
Glencoin Wood Gurness Wood Naddle Forest |
|
|
|
||
| parks |
Parks are not specially drawn, but might be labelled,
eg:-
Gowbarrow Park Glencoin Park |
|
|
|
||
| county |
The counties are not noticed. This may be because drawing
the county boundary, which runs through Ullswater, would
confuse the drawing of sounding lines etc.
|
|
|
|
||
| settlements |
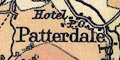
Settlements are marked by blocks, labelled in upright or italic lowercase text. |
|
|
|
||
| roads |
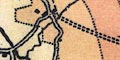
Roads are drawn by double line. They are graded by width, and the more important roads are drawn with a light and bold line. At this relatively good scale, tracks are drawn as well, buy dotted lines. |
|
Lakes Guides menu.